The Toronto Real Estate Board is an overachiever! Market watch reports are often super lengthy, containing loads of data with acronyms that are specific to the real estate board.
If you've ever felt frustrated trying to decipher it, we get it. We've broken down the thing that most people care about, the price.
Here's some quick terms that you need to understand
- Month/Month - means comparing December 2021 to December 2022. They do this to seasonally look at changes in the market as a month in spring will have more activity than December, usually
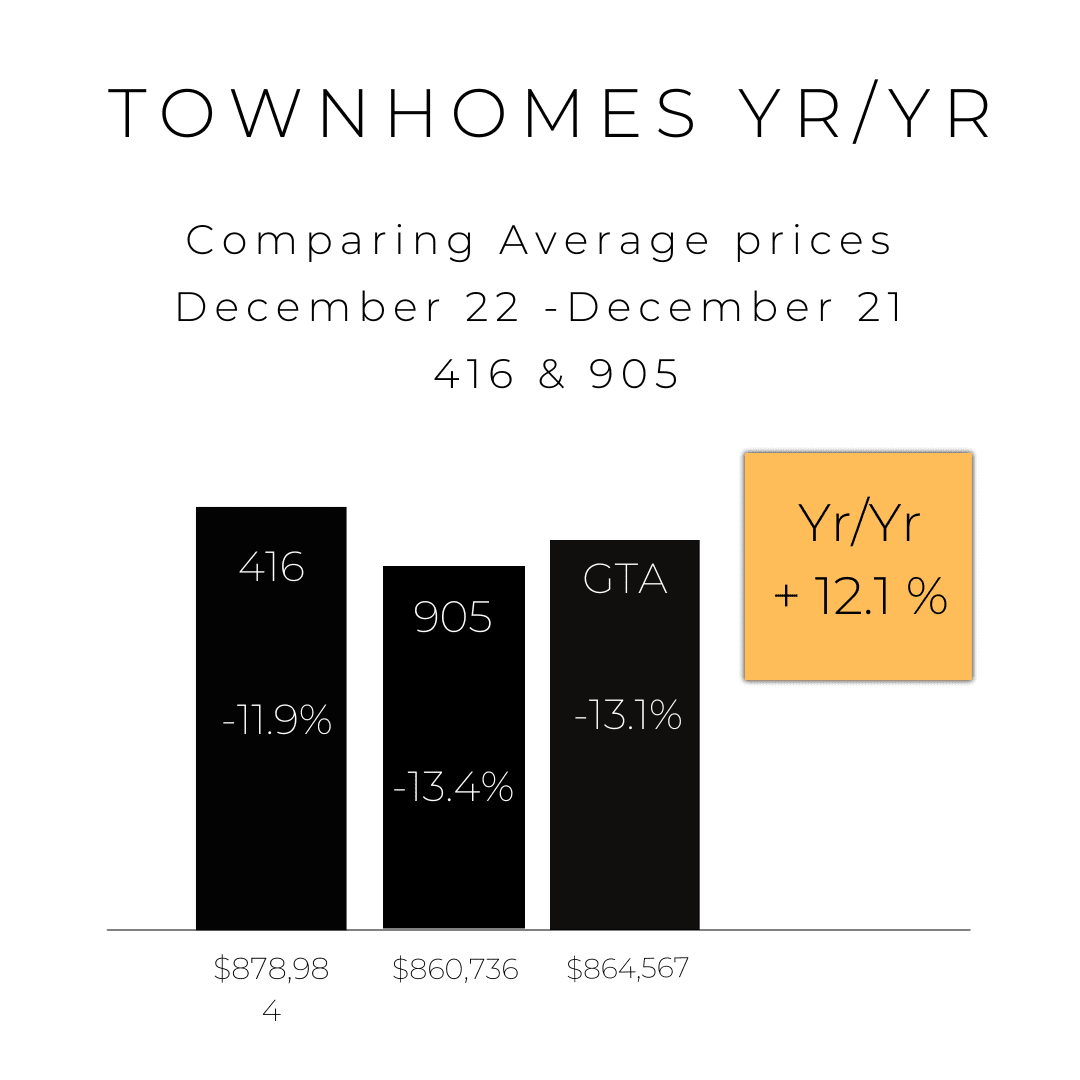
- Year/Year- same thing, but comparing the full year
- Average Price- average sale price. Be careful of this number! In December when sales activity declines, there's fewer properties to use as an average. A few years ago in C08 (Cabbage Town) there was 1 sale that month. Image how that could alter the average.
- Active Listings - means listing on MLS and confusing because they also use New Listings which is a different thing.
- Sales- This is important, as it is the Closed Sales
December 2022 was quiet. Inventory was at an all time low and sales were cut in half (down 48.5%). The low inventory and low sales likely helped soften price decline . As more inventory usually means less competition, driving the prices down.
We do have to keep in mind, we are comparing this year to the record breaking 2021. So although the stats seem drastic, we should be looking at 5 year averages to get a better understanding of the market.
December 2021 detached homes increased by 14.9% in Toronto. In December 2022 detached homes only decreased in price by -4.1%. We are still well above 2021 pricing.
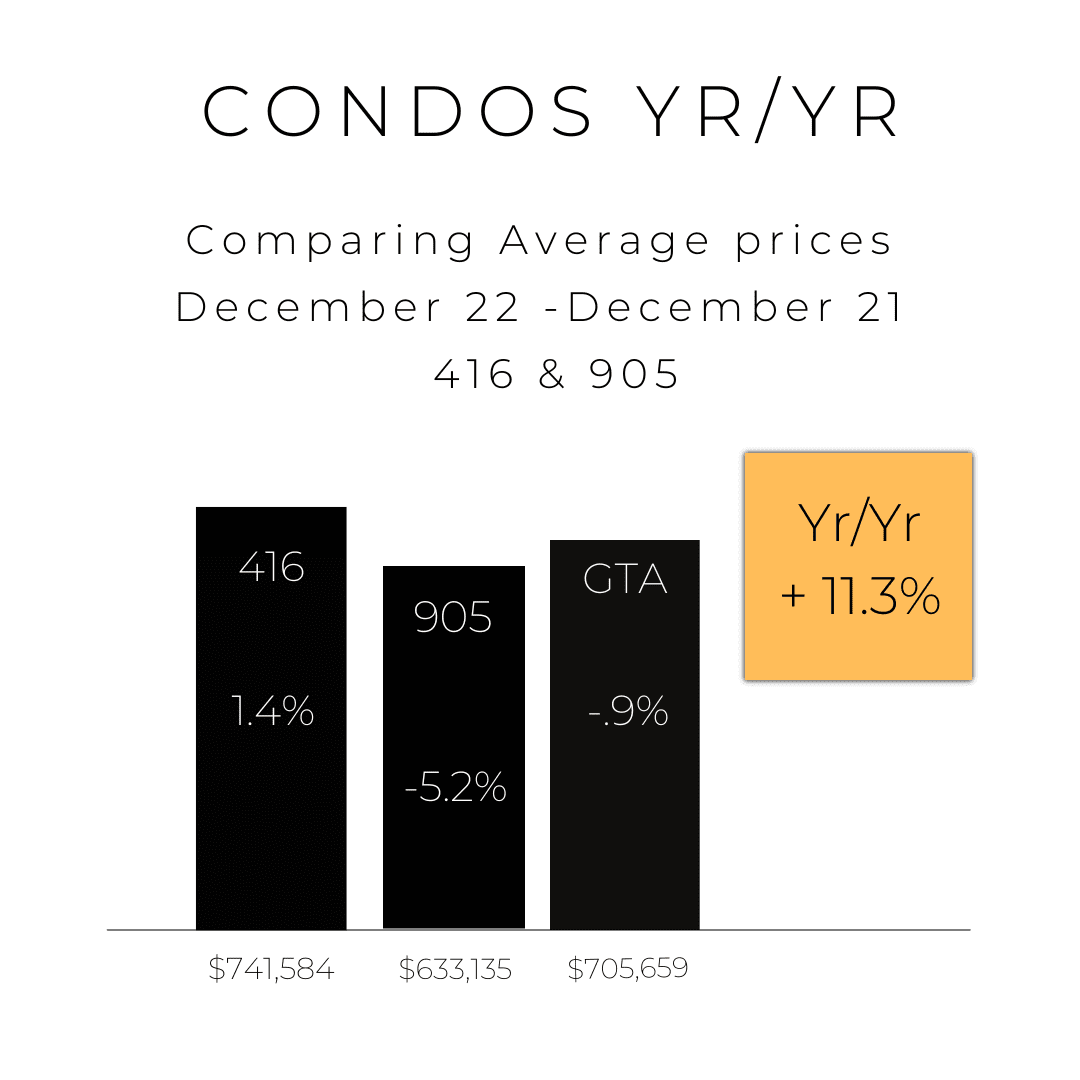
Interestingly, one of the most stable market has been the condo market. It was the hardest hit in the pandemic and has stayed level. Toronto marked 1.4% decrease in condo prices from December 2022/December 2021. While the GTA was only down .9%.
The condo market has peaked the interest of many investors as the rental market continues to climb. This will likely be the best performer in 2023 as buyers find difficulty in qualifying or are just too nervous to purchase. You can image that this will add more pressure to the red hot rental market driving prices further up.
If you're looking at areas that have adjusted the most, it's the 905. Both Detached and Semi Detached homes have adjusted the most in December of 2022.
If you have any market questions, we'd love to chat.
Message/call/text